What is TiPA?
The Tissue Process Activity (TiPA) website calculates the differential activity of biological processes in tissue and cell-type contexts. These differential activities are important for studying tissues and cells physiology on both health and disease. The TiPA website is a user-friendly platform that provides a visualization of the preferential activity of biological processes in human tissues, as well as support cells annotation for single-cell RNA-seq clustering results. TiPA calculation is described in Sharon et al manuscript (2021).
Why or when should I use TiPA?
TiPA enables users to explore tissue and/or cell subset distinct functionalities with several options: (1) For exploring the differential activity of a specific process (or several processes) in tissues, (2) for exploring the most distinct activities in a query tissues relative to other tissues, (3) for exploring processes in which a gene of interest is involved and (4) for supporting cell subset annotation, utilizing data of distinct, unique activity that occurs in a given subset relative to the other subsets.
How the data were integrated?
For calculating TiPA scores, we integrated Gene Ontology (GO) terms of Biological processes that were taken from BioMart (Howe, et al., 2021), and gene expression data that were taken from GTEx V.7 (Consortium, 2020) for calculating fold change (FC) values in tissues. TiPA scores were calculated for processes that include 3-100 genes with FC values. The cell type names and process groups were created based on a human cell atlas of fetal gene expression (Cao et al, 2020).
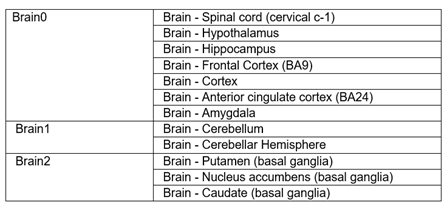
What do Brain0, Brain1 and Brain2 mean?
Brain sub-regions were grouped into three sub-groups, denoted brain0, brain1 and brain2 as follows:
How many processes, tissues and genes are available on the TiPA website?
TiPA provides scores for 6,940 biological processes with 13,798 protein-coding genes in 29 tissues. Among them, 4,105 processes are associated with at least one disease-gene out of 1,053 disease genes.
What is the suggested analysis for my single-cell analysis output?
We suggest two options to utilize TiPA for your data:
First, view the 10 processes with the highest TiPA scores within your query subset. Second, to view the mean TiPA scores of processes belong to cell-identity groups, based on their association with a specific cell type. For example, the process ‘lymphoid progenitor cell differentiation’ (GO:0002320) and the process ‘lymphocyte migration into lymphoid organs’ (GO:0097022) were associated with lymphoid cells.
What is the required single-cell file format to upload?
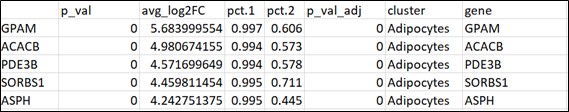
For the processes activity in cell subsets analyses, users are asked to upload a Seurat output file as a CSV file. The output can be obtained by running the function FindAllMarkers, when log fold change thresholds set form -inf to inf, and the parameter min.pct set to 0.
Input file for example:
I have more questions, can I contact you?
Sure! Please email Prof. Esti Yeger-Lotem at estiyl@bgu.ac.il
We would love to hear from you!