MotifNet: A web-server for network motif analysis
Contact: Esti Yeger-Lotem estiyl@bgu.ac.il
1. MotifNet Overview
MotifNet is a tool for the identification of network motifs: small topological patterns that recur in the network significantly more often than expected randomly [1]. MotifNet allows researchers to analyze integrated networks, where nodes and edges may be labelled, and search for network motifs of up to eight nodes. The input to MotifNet includes a node/edge-labelled network and arguments to configure the motif detection algorithm. The output consists of all identified network motifs and their instances in the network. The output motifs are presented graphically and the user can interactively filter the motifs and explore their instances in various ways. For a detailed description of the motifNet web-server see here.
1.1. Using MotifNet
MotifNet contains two main views: The input form (section 2), which is used to submit a network for motif analysis, and the interactive motif browser (section 3), which is used to explore the output motifs and their instances. Upon submission of a new job in the input form, you will be provided with a link to the motif browser where you can view the results once results are ready. Because the execution may take several days, users can provide their e-mail address in the input form, and receive a notification when results are ready. Results remain accessible for two months after the submission of the job.
1.2. Running time
The running-time of MotifNet depends on several factors, including the size of the sought motifs and the analyzed network, the number of random networks to be generated, and the type of enumeration. The table below shows the expected running-time for various inputs (the advances options, except for ‘Enumeration type’, were set to their default values). Exceeding the input sizes listed in this table might result in an overload on our server, and thus failure to perform the motif analysis.
Motif size (# nodes) | Network size (# edges) | Enumeration type | Run time |
3 | 166,302 | Random | 3h 27m |
3 | 166,302 | Exact | 15h 8m |
4 | 32,330 | Random | 21h 36m |
4 | 23,056 | Exact | 3d 6h 13m |
4 | 32,330 | Exact | 8d 5h 18m |
5 | 7,882 | Random | 37h 46m |
5 | 1,373 | Exact | 10h 18m |
6 | 2,746 | Random | 5h 42m |
6 | 1,373 | Exact | 8d 23h 41m |
7 | 1,373 | Random | 46h 31m |
7 | 200 | Exact | 3d 10h 14m |
8 | 300 | Random | 23h 54m |
8 | 200 | Exact | 6d 14h 34m |
1.3. The motif detection algorithm
The identification of the motifs is done with FANMOD algorithm [2,3]. The basic workflow of the algorithm is as follows. The algorithm generates numerous random networks and counts the instances of each candidate motif in each random network. The p-value of the candidate motif is calculated as the fraction of random networks in which it occurs more frequently than in the input network. The generation of random networks is done by a series of edge swapping operations applied on the input network, while preserving the node-degree distribution. During this process, the edges are swapped one after the other. When an edge is swapped, a partner edge is selected randomly, and the two edges swap one of their endpoint nodes.2. The Input Form
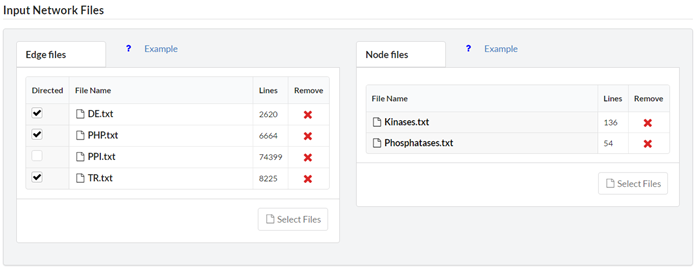
In this form, the user submits the input network to be analyzed, sets the arguments to configure the motif detection algorithm and may provide additional information about the job.2.1. Input Network Files
Enter the input network to be analyzed. The input network may contain several node/edge-labels. The network node and edge labels are given as several tab-delimited files, one file per label. ‘Directed’ – Checked (default) if the edges are uni-directional. ‘FileName’ – The name of the file. ‘Lines’ – The number of lines in the file. ‘Remove’ – Remove the file from the list. Important notes:- The name of each file must be unique. Meaning you cannot submit two files with the same name.
- The files must be text files with a ‘.txt’ extension.
- The format of each line in edge files is: “\t\n”.
- The format of each line in node files is: “\n”.
- The maximal number of node/edge-files depends on the motif size (see the tables in the help pop-up). This is in accordance with FANMOD limitations.
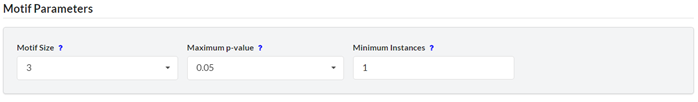
2.3. Advanced Search Options
Configure the motif detection algorithm. ‘Subgraphs enumeration’ – select the way the motif instances are counted and enumerated. Select ‘Exact’ (default) if you want all subgraphs of the selected size to be counted/enumerated, or ‘Random’ if you want to speed-up the analysis with random sampling of subgraphs. ‘Random’ will give less precise results but is much faster than exact enumeration, thus is highly recommended for searching motifs of 5 nodes or more. Upon selecting ‘Random’ you may provide sampling probabilities. The multiplication of these probabilities is the probability for one single subgraph in the network to be sampled. In the algorithm, each subgraph is extended node after node in a seed-and-extend technique. The sampling probabilities correspond to the probabilities to sample the nodes of each candidate subgraph. The left-most number is the probability for the first node in the subgraph to be sampled, the second left-most number is the probability for the second node in the subgraph to be samples, and so on. Note that you should select high probabilities in the left fields to spread the samples evenly in your network. ‘Bidirectional edges swapping’ – select the way bidirectional edges will be swapped. ‘Stringent’ (default) – bidirectional edges are only swapped with bidirectional edges. ‘Non-stringent’ – a bidirectional edge could be destroyed during swapping but the number of bidirectional edges is kept constant in the overall network. ‘No regard’ – bidirectional edges can be created and destroyed during randomization. ‘Ignore node-labels’ – Edges are swapped only if their endpoint nodes have the same label. Activating this option will remove this restriction. ‘Ignore edge-labels’ – Edges are swapped only if they have the same label. Activating this option will remove this restriction. ‘Number of randomized networks’ – Specifies the number of random networks to be generated and analyzed in order to calculate the p-values of the motifs. The higher the number, the more accurate the results, but computation requires more time. ‘Swapping per edge’ – Specifies how many times each edge will be swapped during the generation of the random network. To achieve a better sampling of the random network space you should increase this number, but be aware it will require more computation time. ‘Swapping attempts per edge’ – When an edge is swapped, a candidate edge for swapping is randomly selected. Occasionally, this candidate edge may not be suitable for swapping (e.g. if both edges start/end at the same node). In this case, another candidate is selected. This procedure is repeated until the swapping is successful, or until the number of swapping attempts (specified in this box) is exceeded. The number of swapping attempts per edge should be increased when the input network is dense, or contains many highly connected nodes (hubs).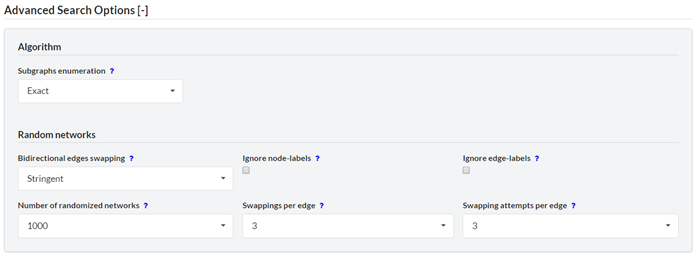
2.4. Job Details
Optional. Provide additional meta-data regarding the job. ‘Job name’ – Up to 10 characters, including English characters, numbers and hyphen signs. ‘Email address’ – use this option to get an e-mail notification when results are ready. ‘Comments’ – Up to 200 characters, including English characters, spaces, numbers and hyphen signs.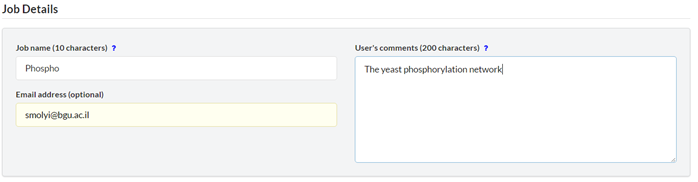
3. The Interactive Motif Browser
This interface is used for exploring the identified motifs and their instances. It appears upon clicking the link provided to the user after the submission of a new job in the input form. Registered users can also access this interface via the session table.3.1. The motif card
Each output motif is represented as a card. The card contains the motif ID, a graphical illustration, and details about the motif. There are two buttons in the top right corner by which the user can download all the motif instances as a tab-delimited text file, or explore the motif instances in the motif instance exploration window (see section 3.3). ‘ID’ – the adjacency matrix that represents the motif. The numbers in the main diagonal correspond to the nodes and their labels. The other numbers correspond to the edges and their labels (‘0’ means there is no edge). ‘Instances’ – number of motif instances. ‘P-value’ – the p-value is computed as the fraction of randomized network, in which the motif had more occurrences than in the original network. ‘Z-score’ – the motif’s z-score. ‘Motif dispersity’ – number of unique nodes that occur the motif instances divided by the number of motif instances and by the size of the motif (see Section 4). ‘Lowest/Highest position dispersity’ – the minimal/maximal position dispersity (see Section 4).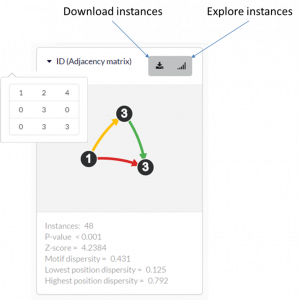
3.2. The motifs filter form
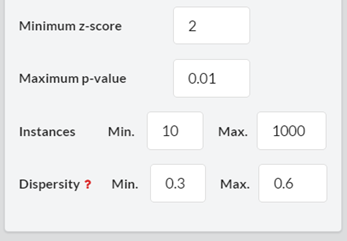
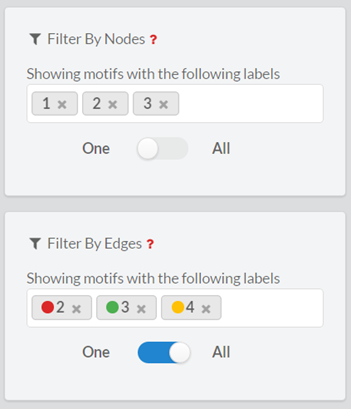
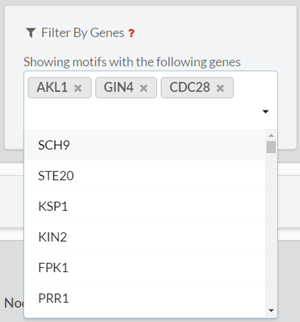
In this form, the user can filter the output motifs by their properties (ID, z-score, p-value, number of instances and motif dispersity), by the node/edge-labels they contain and by the genes that are involved in them. The filters are applied altogether.3.2.1. ‘Search by ID’
Search for a specific motif by entering the linear representation of its adjacency matrix.
3.3. The motif instance exploration window
In this view, the user can explore the instances of a selected motif. This window appears when a user clicks on the ‘explore’ button of a specific motif (see section 3.1).3.3.1. The instances table
Each row corresponds to some motif instance and each column corresponds to a specific position (node or edge) in the motif. ‘Search a gene’ – search for specific entries in the table.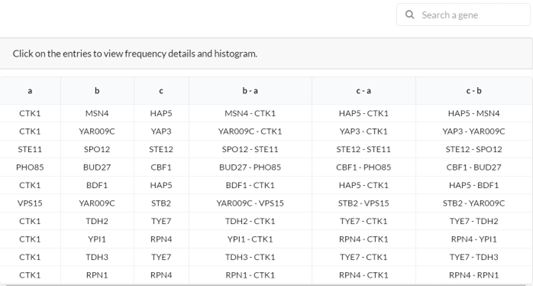
3.3.2. The motif card (in the instance exploration window)
In the motif card (see section 3.1 for explanation about the motif card), each node is assigned with a character (‘a’, ‘b’, ‘c’, …) that corresponds to a specific column in the instance table. In addition, a dispersity measure is computed and presented for each position in the motif (see dispersity in section 4). ‘Dispersity in position x’ – number of unique nodes that occur the motif instances in position x divided by the number of motif instances.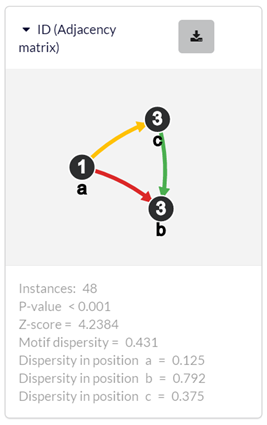
3.3.3. The nodes/edges frequency histogram
The frequency histogram shows the frequencies of nodes/edges that occur in the motif instances. Each bar corresponds to a specific node/edge. To view the frequencies of nodes/edges in a specific column in the table, click on that column. ‘All nodes’ or ‘All edges’ – show frequency of all nodes or edges, respectively. ‘Display top’ – select how many bars will be shown of the highest scoring bars. For example, choosing 100 will display the 100 most frequent nodes in the motif.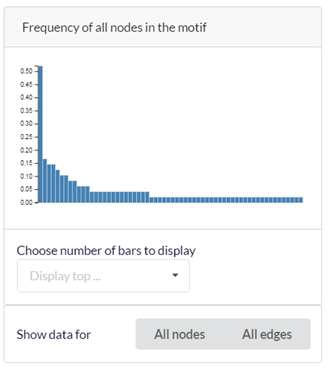
3.3.4. Node/Edge data
The ‘Node/Edge data’ box shows information about specific nodes/edges, upon clicking on their name in the table, or on the bars of the histogram. ‘Node/Edge name’ – the name of the gene or the interaction. ‘Occurrences in motif’ – number of instances in which the node/edge occurs. ‘Frequency in motif’ – number of instances in which the node/edge occurs relative to the number of motif instances. ‘Total nodes/edges in motif’ – the number of nodes/edges that occur in the motif instances.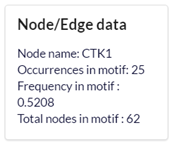
4. Dispersity
4.1. What is dispersity?
The dispersity measures reflect how heterogeneous a motif is, in terms of the genes that occur in its instances. This measure helps in distinguishing between dispersed motifs, which are independent of each other and might have evolved through different routes, and local motifs, which are localized around a small subset of nodes and may illuminate their functions. Note that when distinguishing between disperse and local motifs, the number of motif instances should be taken into account. For example, a motif with low dispersity, but with over 1,000 occurrences cannot be considered as a local motif.4.2. How is it computed?
The ‘Motif dispersity’ is computed as the total number of genes that appear in the motif instances, divided by the number of motif instances and by the size of the motif. For example, for a 3-node motif that has 10 instances that include 20 different genes, dispersity equals to 20/(3*10) = 0.6667. Note that the ‘Dispersity’ equals to 1, only if there are no overlapping genes in any pair of motif-instances, and values close to 0 imply that many instances have common nodes. The ‘position dispersity’ is computed for each position in the motif. This is computed as the number of genes that appear in the motif instances in that specific position, divided by the number of motif instances. For example, given the same motif as above, and assuming that in position X of the motif there are only 3 genes across all instances, then the position dispersity of position X is 3/10=0.3. Following this definition, ‘Lowest position dispersity’ and ‘Highest position dispersity’ are the minimal and maximal position dispersity, respectively.5. The Navigation Menu
The navigation menu contains the following options: ‘New job’ – open the MotifNet input form where the user can submit a new job for motif analysis. ‘Sessions’ – view all previous sessions that were submitted by the user. This option is shown only when you are logged-in. ‘Example Session’ – open the interactive motif browser for the example application which is described in MotifNet’s paper. ‘Tutorial’ – open this tutorial page. ‘FAQ’ – frequently asked questions page. ‘Login‘ – open the logging-in form. ‘Logout’ – logging-out from MotifNet. This options is shown only when you are logged-in. ‘Contact’ – our contact details.
6. Registration
MotifNet does not require any logging-in for the execution. However, it offers an option to register. Registered users can browse and access their previous sessions via the session table. To register, the user must provide a user name and may provide also his e-mail address.
7. Implementation
The MotifNet website is implemented in ReactJS infrastructure and designed with Semantic-UI. The server-side program is implemented in Python 3. The identification of the motifs is done with FANMOD algorithm (see section 1.3) , which is executed with Ubuntu 14.04 on an Intel Xenon 2GHz processor with 112GB RAM. All the information, including user and job details, and the output motifs and their instances, is maintained in MySQL database.
REFERENCES
- Milo, R., S. Shen-Orr, S. Itzkovitz, N. Kashtan, D. Chklovskii, and U. Alon, Network motifs: simple building blocks of complex networks. Science, 2002. 298(5594): p. 824-7.
- Wernicke, S. and F. Rasche, FANMOD: a tool for fast network motif detection. Bioinformatics, 2006. 22(9): p. 1152-3.
- Wernicke, S., Efficient detection of network motifs. IEEE/ACM Trans Comput Biol Bioinform, 2006. 3(4): p. 347-59.