Welcome to the TiPA website!
The Tissue Process Activity (TiPA) website calculates the differential activity of biological processes in tissues and cell types. It relies on bulk or single-cell transcriptomes and Gene Ontology biological processes.
TiPA website calculates per process the mean differential expression of process genes in a tissue or cell subset relative to a background set composed of all other tissues or cell subsets.
Every page contains the following three icons in the top right of the screen:

Link to TiPA homepage

Opens TiPA homepage in a new tab

Link to TiPA tutorial
TiPA website offers several types of queries:
Cell subsets query
Users can upload a differential gene expression dataset of cell subsets obtained via Seurat analysis of single-cell data, with the function FindAllMarkers, when log fold-change thresholds set form -inf to inf, and the parameter min.pct set to 0.
The file should be uploaded as CSV format as the following example:
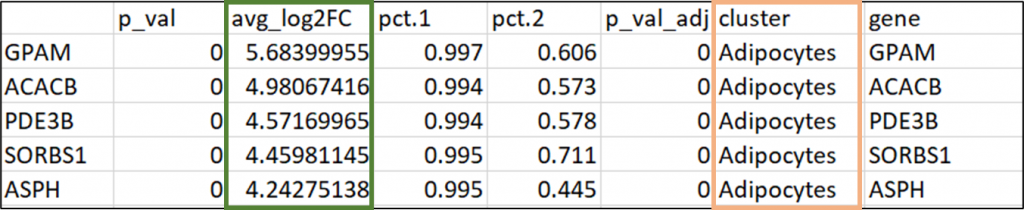
The ‘cluster’ column (marked in orange) can include subsets numbers or names (if they have already been annotated). TiPA scores will be calculated by the average log fold change values (marked in green).
Then, users can choose between two options of output, both aiming to support cell subsets annotation.
The first option is to calculate the top preferentially active processes per subset. For this, users will be asked to select their subset of interest from a list consisting of the subsets in their data. This selection can be done multiple times for different subsets.
Output example:
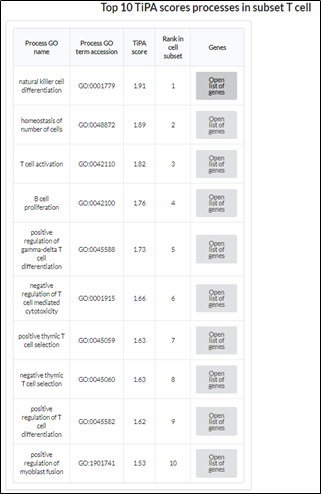
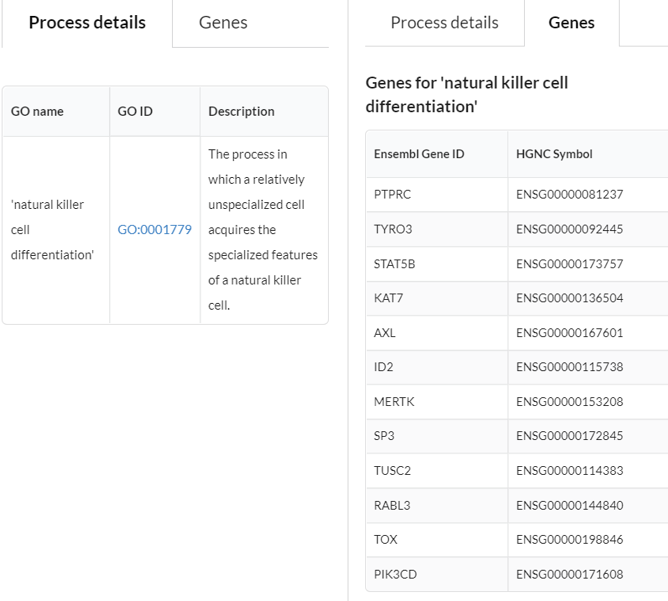
The output table (as shown above) describes the 10 most differential active processes in the query subset. For each process, clicking on “Open list of genes” will open a separate table that displays the selected process’s details: its name, ID and description, as well as the list of the genes that are involved in the process and were part of the TiPA calculation.
For example:
The second option is a display of suggested subset annotations based on the differential activity of processes that are specific to known cell types.
Output example:
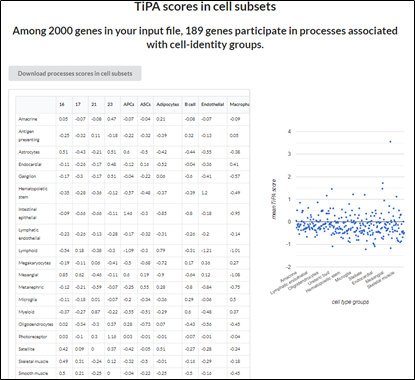
The output includes two parts: On the left, a matrix consists of the known cell types (rows) and cell subsets from the user’s data (columns). For each cell subset, there are suggested annotations based on the differential activity of processes, which users can order by their TiPA scores. On the right, a graphical view of this matrix.
Users can also download full output data by clicking on the upper button: “Download processes scores in cell subsets”. The file includes the TiPA scores for all processes in analysis in subsets.
Process(es) in tissues query
Select a process or multiple processes from the dataset. You can scroll the list or type the process name.
Select one or more processes from the list, and view the differential activity of query process or processes, as a bar plot or a heatmap, respectively. Data are displayed also in a following table, describing GO process names, TiPA scores in tissues, and their significance.
Clicking on a specific row in a heatmap or table will lead to a single process view with relevant data regarding the specific query process.
Output example:
Single process view
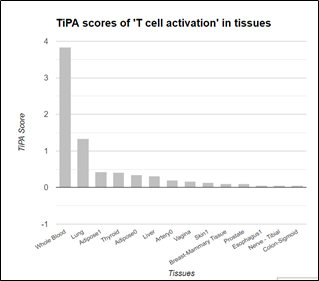
A detailed table with TiPA scores of the query process in 29 tissues is displayed below the bar plot.
Users can click on each of the tissue rows in the table to view the 20 most preferential active processes in the selected tissues (see Query Tissue).
Multiple-processes view
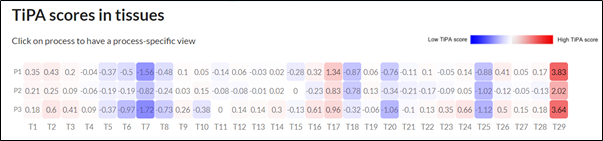
Clicking on a process row in the heatmap or in the table that is displayed below the heatmap will lead you to a single process view.
Tissue query
1. Select a tissue out of tissues list.
2. Select a required number of top-scored processes you would like to view for your query tissue.
3. Check the box “Display processes with disease gene/s only” for viewing only processes including at least one disease-causing gene.
Output example for top 10 processes in liver:
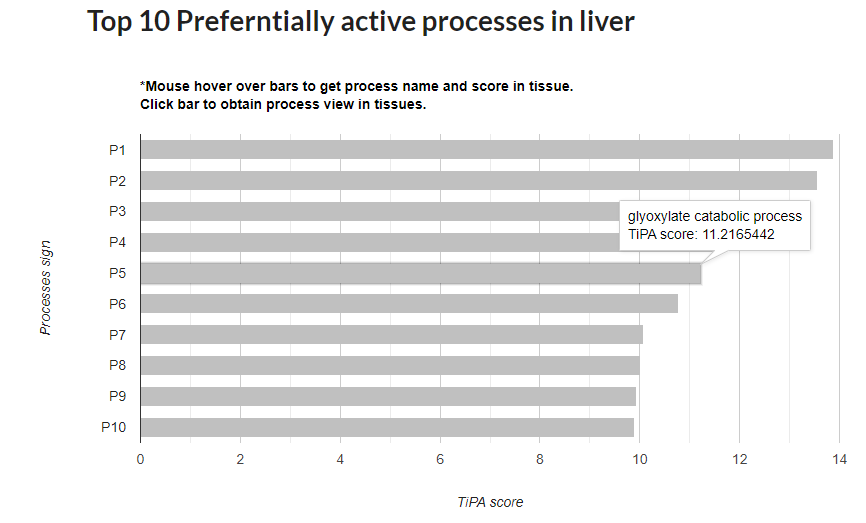
Each bar represents a TiPA score for a process. Mousing over bars will reveal the process name and its TiPA score in the query tissue.
Below the barplot there is a table with names, IDs and processes. Clicking on “Open list of genes” will also display the genes involved in the process and its description.
Gene query
Select a query gene from the list of the genes (all are associated with the available processes). Users can filter the genes to disease-causing genes by checking the box “Display disease genes only”.
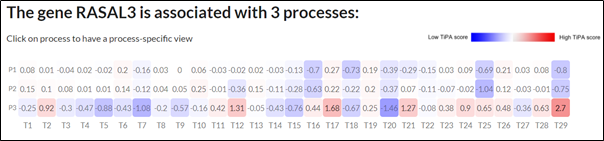
If the query gene is associated with one process, a single process view will be displayed. If the query gene is associated with several processes, a multiple processes view will be displayed.
Output example for a gene associated with several processes:
Have further questions? Need more clarifications?
Please don’t hesitate to contact us at estiyl@bgu.ac.il.
Thank you!